How It Investigates
User-reported symptoms and suggested fixes are treated as starting points for investigation, not conclusions. The goal is to find the real issue, which could often be upstream of where the problem surfaces. It reads files directly by path with optional line ranges, reads multiple files simultaneously when tracing across modules, and searches file contents by pattern to follow state through code paths to their origin. Once the origin is found, Debug evaluates where the fix should live. A fix at the source prevents the problem for every downstream caller automatically. A fix at the symptom only handles one path. Debug always identifies which type of fix it’s applying and why. For straightforward issues it runs end to end within a single agent, but delegates specialized subagents for problems spanning multiple services .Eight-step methodology
Potpie applies an eight step methodology to every issue:Understand and validate
Confirms the reported behavior against the codebase, identifies every component involved, and establishes what the correct behavior should be at the point of failure.
Explore and hypothesize
Traverses the relevant code paths in the context graph and generates candidate explanations for the failure.
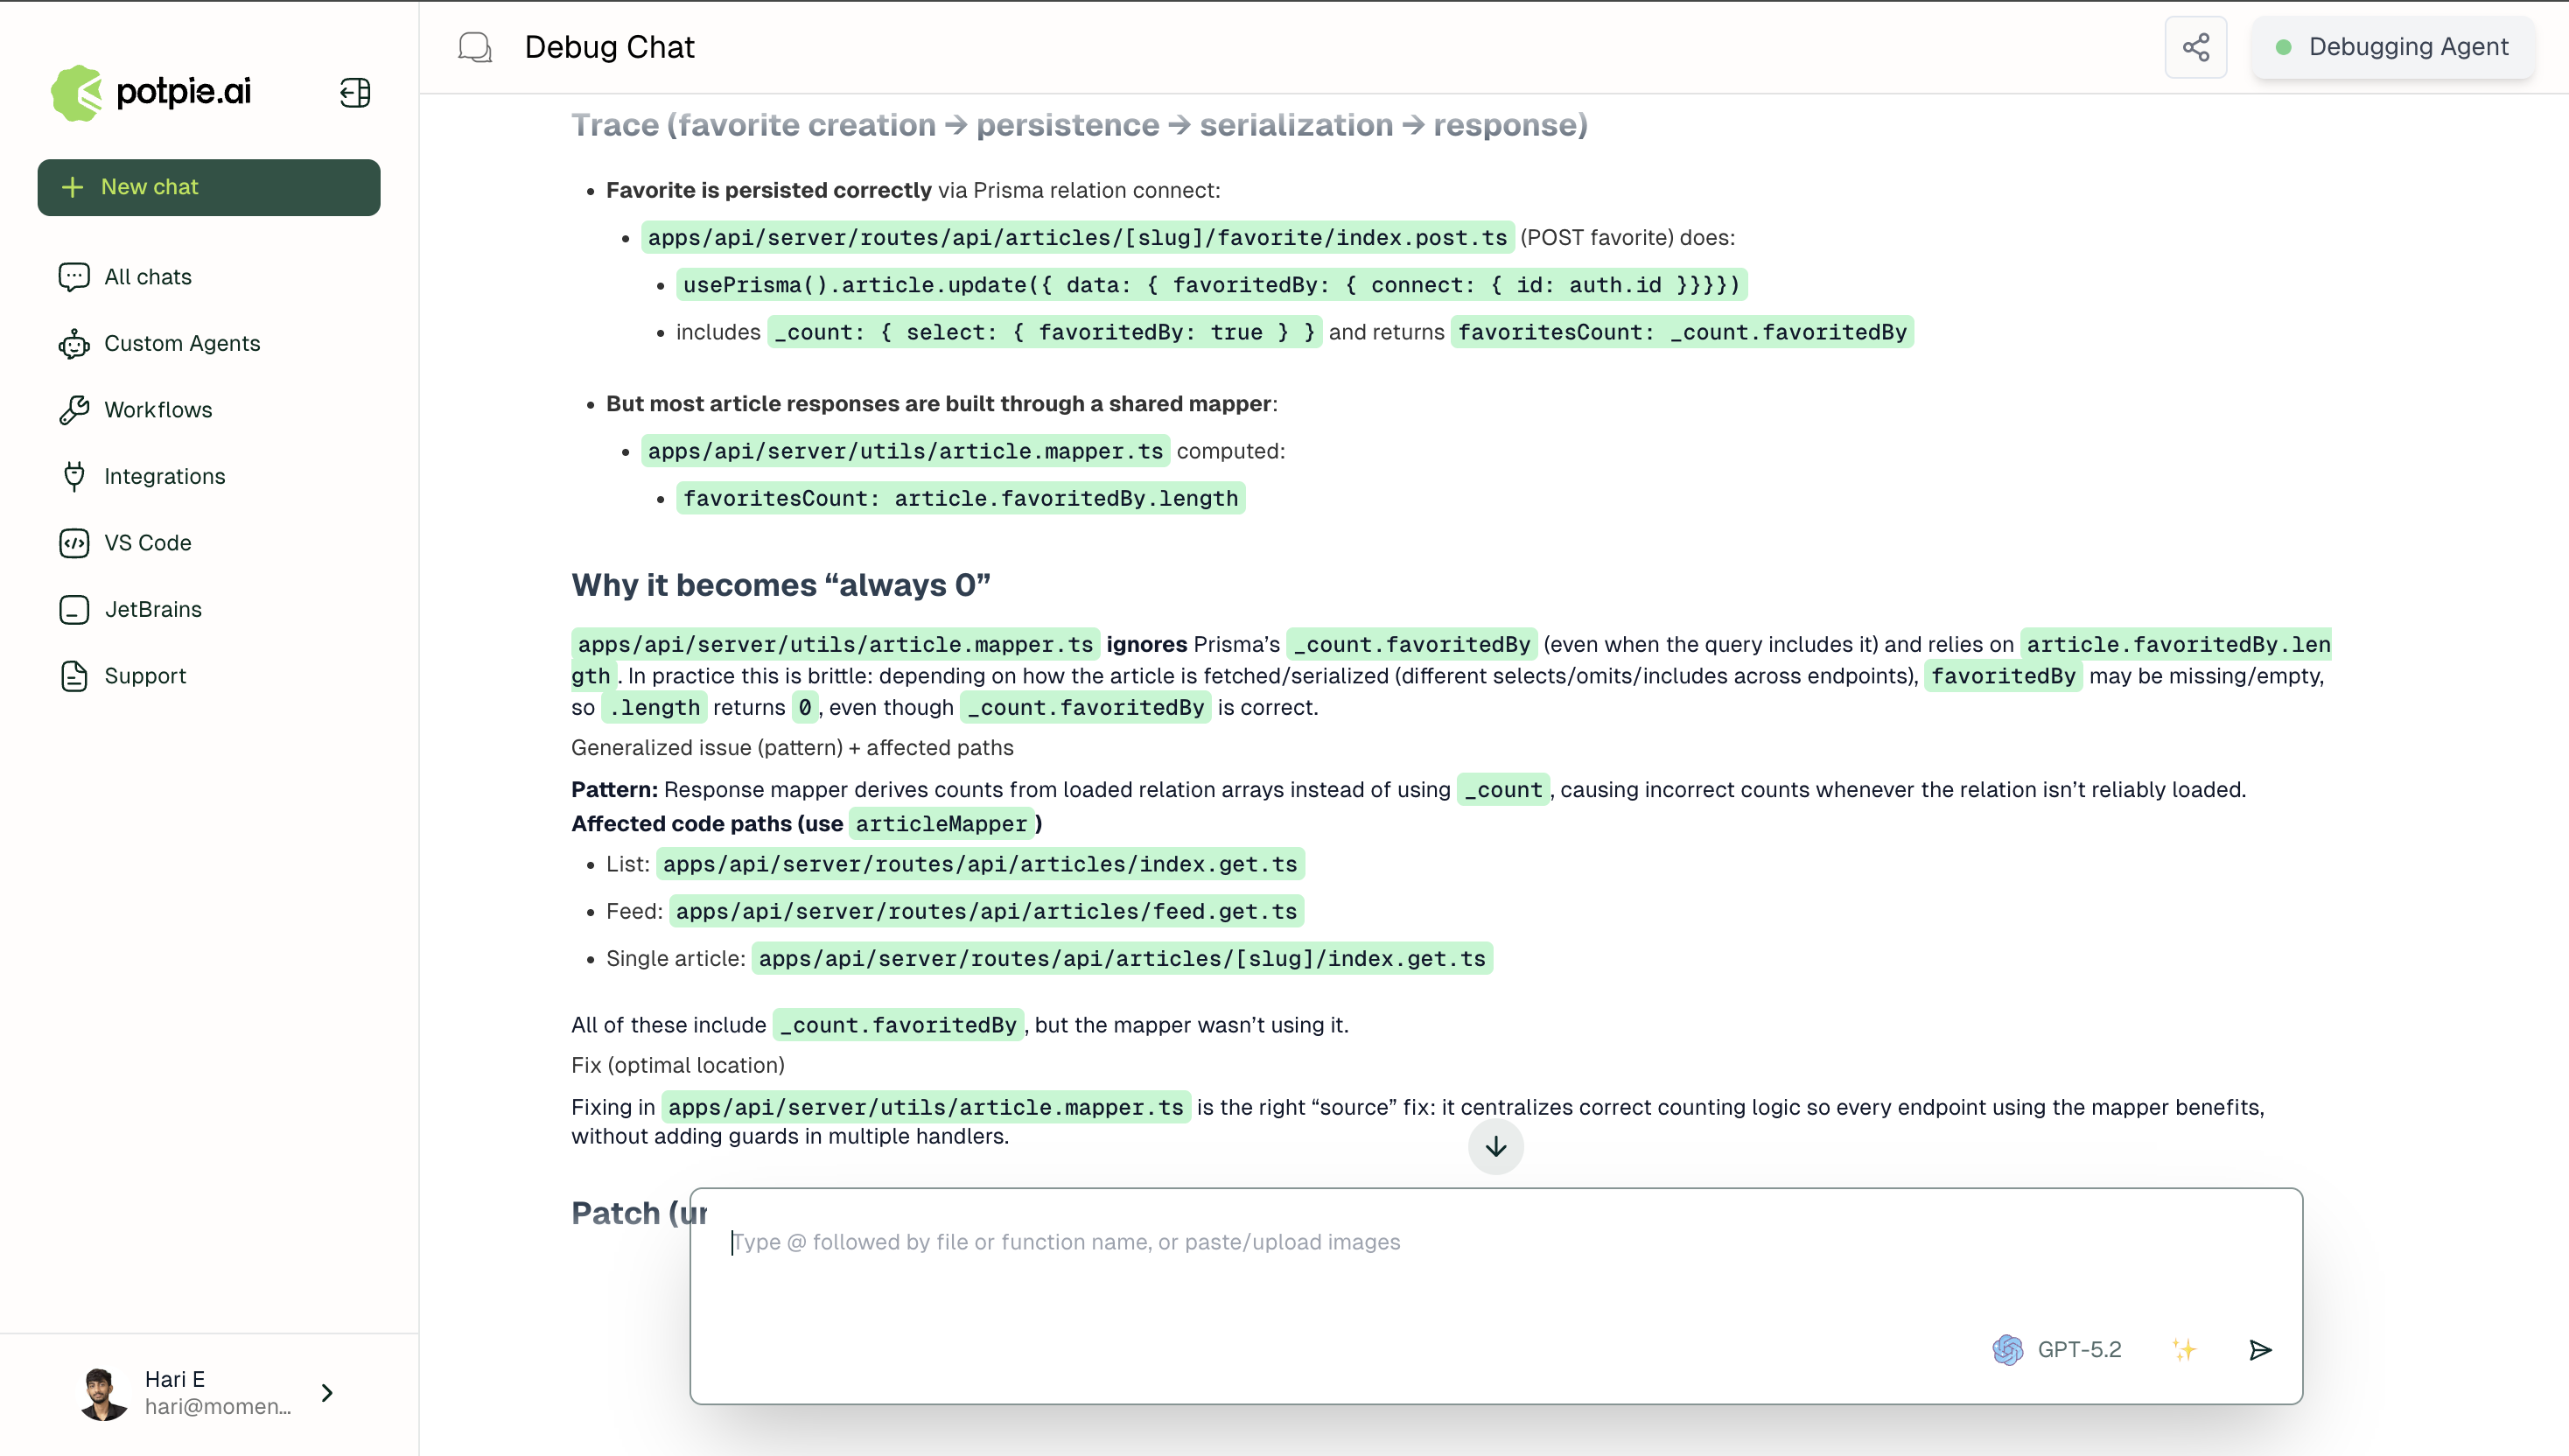
Identify the root cause
Pins the failure to a specific file and line, identifying the exact instruction that introduces the faulty state.
Scrutinize and refine
Evaluates the fix against edge cases and traces potential side effects through the context graph.
What It Returns
The result is a root cause traced to its true origin, a clearly mapped path from origin to symptom, and a fix that resolves the underlying generalized issue rather than only the specific reported instance.Using the API
For local workflows, start with the CLI Overview, parse the repository, and then inspect the relevant graph slice before debugging through it.Example uses
Null Pointer
Tracing a null pointer exception to its origin across service and data layers.
Memory Leak
Tracing a memory leak in a long-running service to its source across object lifecycle and dependency chains.